With local elections in the offing, it seems an appropriate time to ask whether there is any relationship between surnames and politics, or at least with those men and women standing for election to Cornwall Council next month.
In 1889, when Cornwall County Council was set up, over two thirds, or 71% of the newly elected councillors and aldermen had one of the 700+ surnames that appear in my The Surnames of Cornwall. That was at a time when around 90% of the population of Cornwall had been born in Cornwall.
But what proportion of those currently seeking election share these 700 or so surnames?
Here’s the answer, with the numbers in the first election to the unitary authority in 2009 provided for contrast. (The 2009 figures for the smaller parties – Greens, MK and Ukip – include the following election of 2013 to make the numbers more meaningful.)
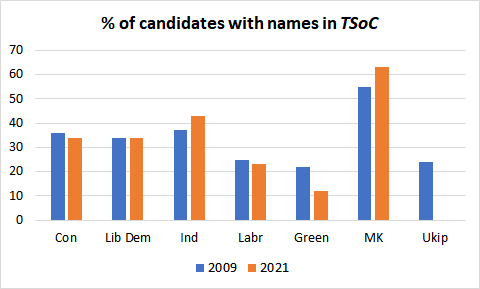
For the three main political groupings the proportion is around a third. Any differences are insignificant, well within the sampling error. There is a slight hint that Independents may be more likely to have one of the surnames in the book but not spectacularly so.
The real differences, even allowing for the lower numbers, occur with the smaller parties. Only one in four of Labour candidates are found to have names in The Surnames of Cornwall, a very similar proportion as Ukip back in 2009/13. The Greens are even less likely to have one of my 700 names, with the proportion falling even further as the number of their candidates rises.
Not surprisingly, given their alternative title of The Party of Cornwall, we might expect MK to have a proportion more closely approaching that of 1889. However, the low number of candidates this year makes the figure for 2021 subject to a very large sampling error. And even among their candidates the number who share the entries in The Surnames of Cornwall is significantly lower than in their great-grandparents’ time.
