
A lot of often conflicting nonsense has appeared on both social media and the ‘mainstream’ media about how far this virus is present in Cornwall or the number of cases and deaths. Let’s look at what we know.
By the end of May the ONS had recorded 200 deaths in Cornwall where Covid-19 was cited as a cause of death or a contributory factor.

A map of those deaths shows a spread across the land with only a few places – Newlyn East and Grampound Road, Padstow, St Breward, Tintagel and Torpoint and the Rame peninsula – escaping with no mortalities. More generally, the more rural north of Cornwall looks to have best survived the outbreak. Other rural areas, for example the Lizard or mid-Cornwall between St Columb and Lostwithiel – have also seen relatively few victims. However, rurality has not guaranteed immunity. The rural Probus and Roseland has recorded the highest number of deaths, while the district east of the Fowey River has also suffered more than average.
That rurality is no magic bullet is confirmed by this map of detected cases per head across the UK.

Areas that are as rural, if not more so, than Cornwall such as East Anglia, North Yorkshire or Powys in Wales have seen twice as many detected cases. Meanwhile, Cumbria has had four times the Cornish number. A marginal location also seems important. Those regions with a lower number of cases per resident than Cornwall are Dorset and rural Devon in England, Ceredigion in Wales, the Highlands in Scotland and Fermanagh and Omagh in Northern Ireland.
Clearly the number of cases reported is only the tip of the iceberg. Currently the total of detected cases in Cornwall is running at 591. Given an assumed mortality rate of somewhere between 1 and 10% we should expect the real figure, based on 200 deaths, to be more like 2,000 to 20,000! Either the proportion detected is very low or we have an unusual and shockingly high mortality rate.
Overall however, Cornwall has fared relatively well. ‘Well’ in the context of the UK is of course pretty bad when compared to most of the rest of the world. Two hundred early and unexpected deaths are hardly cause for congratulation.
Moreover, before becoming too complacent we might note the final piece of evidence – the seven-day rolling average of detected cases in Cornwall.
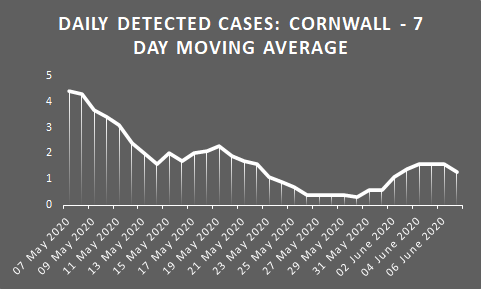
For what it’s worth, this suggests that after a steady fall from early May, there was a small but significant jump in the number of cases in the first week of June.
The virus is still out there, so as the tourist sector eagerly gears up to resume its operations it’s best to remain vigilant and take care.

I suggest the increase in detected cases is because the volume of testing has increased. Positives as a proportion of total tests is a better indicator. National NAO figures show a steady decline trend where the pure volume shows something like the bump curve shown here. Of course, the only way of being clear would be to test everyone, while also being clear about the distinction between antibody and virus detection.
LikeLiked by 1 person
Good point.
LikeLike